Changelog:
- "Maximised transaction fee" plot replaced with "Percentage of maximum block size used" plot.
Errorlog:
- Nil.
Notifications:
- This is a work in progress, and will be continuously optimised (fiddled with). Feel free to comment - you might just see your suggestion appear.
0. Network hashrate has plateaued
To those who thought the network hashrate would crash after the most recent drop in the exchange rate, you need to read some bitcoin history. While the network hashrate can rocket upward, a drop in hashrate is a very slow gentle affair. If the network hashrate decreases, it will do so slowly - unless the hashrate drops by an order of magnitude.
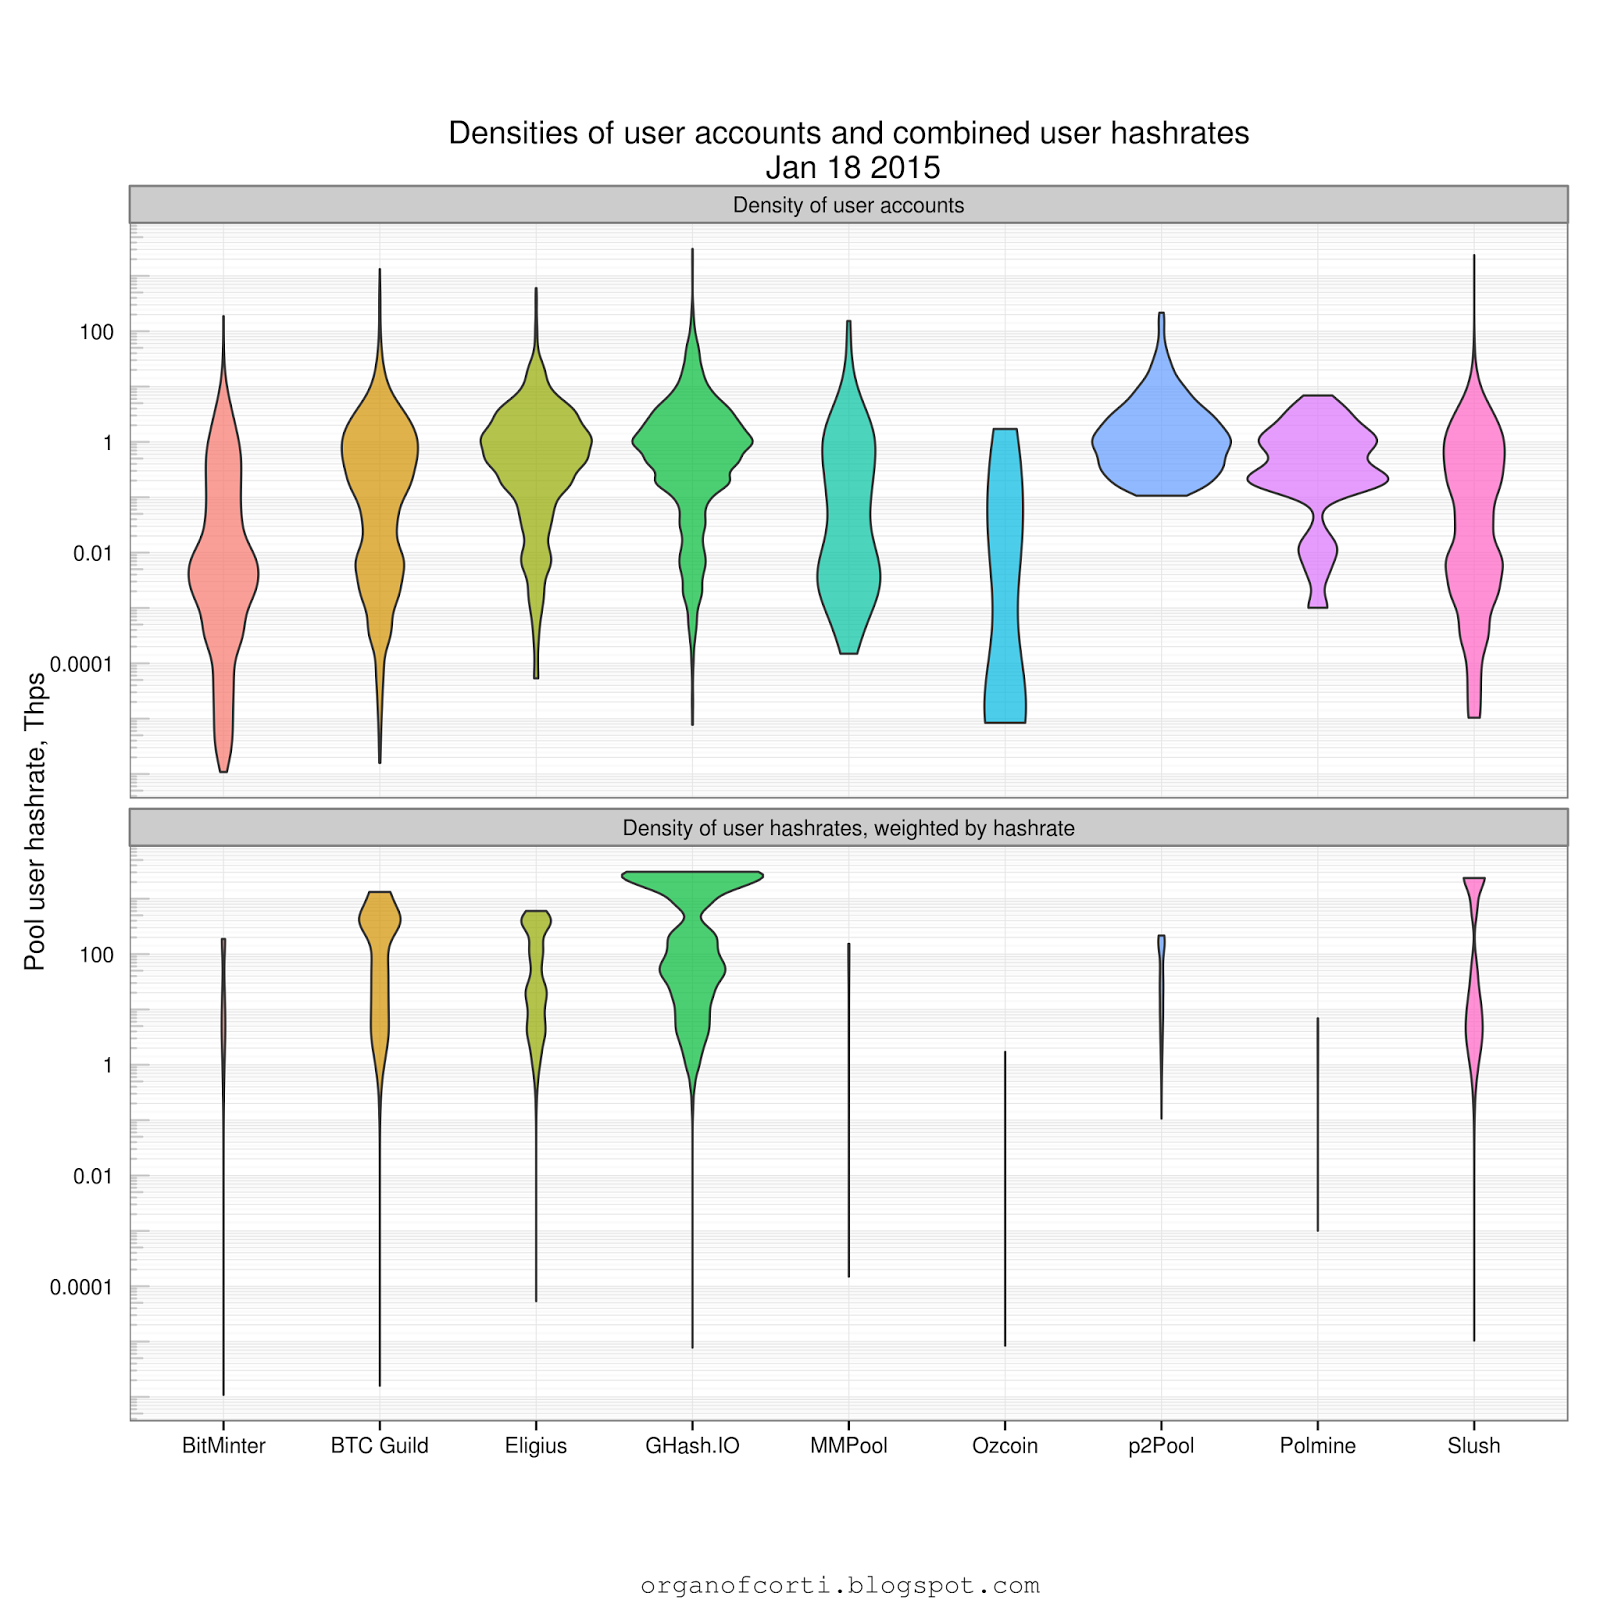
1. Large drop in estimated number of miners in network.
On the 13th January, GHash.IO reported a drop from 34000 active user accounts to 6000 active user accounts, which since then has dropped further to 5500 active user accounts. This sudden drop of more than twenty-eight thousand user accounts has significantly affected the total number of miner estimate.
Why did they suddenly lose so many user accounts? Assuming the is no error on their part, My guess is that these cancelled user accounts are from the no longer profitable cloud-mining side of their operation, CEX.IO.
If you compare the changes in the miner hashrate distribution from last week to this week, it becomes obvious that low hashrate miners have left and the hashrate distribution is much like that of other pools:


The average and median hashrate also both increased slightly this week, which is consistent with a loss of low hashrate miners.
All this means that the previous estimates of miners actually included some cloud miners, which was not my intention.
2. Percentage of maximum block size used
After reading Dave Hudson's excellent post "The Myth Of The Megabyte Bitcoin Block", I realised that rather than plot the maximised transaction fee per block, it would be better to just plot the percentage of the block filled - the percentage of the maximum block size per block. Useful change?


Miner profitability and forecast


Transaction fees


Estimated mean and median miner hashrate

Estimated number of miners

Thank you to blockchain.info and coinometrics.com for use of their transaction and address data, and coincadence.com for their p2pool miner data.

On the 13th January, GHash.IO reported a drop from 34000 active user accounts to 6000 active user accounts, which since then has dropped further to 5500 active user accounts. This sudden drop of more than twenty-eight thousand user accounts has significantly affected the total number of miner estimate.
Why did they suddenly lose so many user accounts? Assuming the is no error on their part, My guess is that these cancelled user accounts are from the no longer profitable cloud-mining side of their operation, CEX.IO.
If you compare the changes in the miner hashrate distribution from last week to this week, it becomes obvious that low hashrate miners have left and the hashrate distribution is much like that of other pools:

The average and median hashrate also both increased slightly this week, which is consistent with a loss of low hashrate miners.
All this means that the previous estimates of miners actually included some cloud miners, which was not my intention.
2. Percentage of maximum block size used
After reading Dave Hudson's excellent post "The Myth Of The Megabyte Bitcoin Block", I realised that rather than plot the maximised transaction fee per block, it would be better to just plot the percentage of the block filled - the percentage of the maximum block size per block. Useful change?
The network hashrate
The
plots below show the network hashrate since block height 1, for the
last year and for the last six months. The mean estimate is calculated
using the daily average hashrate.
The
second and third charts also include confidence intervals for the
hashrate, the mean hashrate estimate, and a 28 day forecast estimate.
- The dashed line is the mean hashrate estimate.
- The grey shaded area is the 95% confidence interval for the mean hashrate estimate.
- The dotted line is the 95% confidence interval for daily hashrate averages, given the mean hashrate estimate, so 95% of the large grey dots (average daily hashrate) should be within the dotted line.
- The blue shaded areas are the confidence intervals for the forecast.
- Forecast confidence intervals are bootstrapped.
You notice that the mean forecast
is not given - just the confidence intervals. The reason for this is
that in the past people have focussed on the mean forecast, but I think
the range of values the network hashrate could take is much more
important.
Miner profitability and forecast
- The first plot below shows the weekly miner income and cumulative miner income for the past 52 weeks.
- The second plot shows the weekly miner income for the past 26 weeks with an eight week forecast.
- The third plots shows the cumulative miner income eight week forecast.
- Forecast confidence intervals are bootstrapped.
Again,
the mean forecast is not given for the same reasons I gave previously.
Eight weeks forecast is possible as these are weekly summary statistics;
for daily summary statistics (such as above) only four weeks forecast
is possible with any accuracy.
Transaction fees
Transaction
fees are often overlooked by miners but will become very important for
them - as the block reward decreases, transaction fees
must necessarily go some way toward ameliorating the loss in block
reward.
However,
as can be seen in the top facet of the second plot below the
transaction fees per block are not increasing - or even maintaining - a
percentage of the block reward.
The
lower facet plots the percentage of block the maximum possible block size that was used.
Estimated mean and median miner hashrate
This estimate is actually the average and median percentage of the network contributed by each miner.
Standard error has been calculated using bootstrapping resampled data, and is shown by the shaded area.
Estimated number of miners
This
has been estimated using the miner hashrate distribution that some
pools provide and using a model to estimate the number of miners on
pools that do not provide such data.
Standard error has been calculated using bootstrapping resampled model data, and is shown by the shaded area.
organofcorti.blogspot.com is a reader supported blog:
1QC2KE4GZ4SZ8AnpwVT483D2E97SLHTGCG
Created using R and various packages, especially dplyr, data.table, ggplot2 and forecast.
Recommended reading:
- For help on ggplot2.
- For help on forecasting.
Thank you to blockchain.info and coinometrics.com for use of their transaction and address data, and coincadence.com for their p2pool miner data.
Find
a typo or spelling error? Email me with the details at
organofcorti@organofcorti.org and if you're the first to email me I'll
pay you 0.01 btc per ten errors.
Please refer to the most recent blog post for current rates or rule changes.
I'm terrible at proofreading, so some of these posts may be worth quite a bit to the keen reader.
Exceptions:
- Errors in text repeated across multiple posts: I will only pay for the most recent errors rather every single occurrence.
- Errors in chart texts: Since I can't fix the chart texts (since I don't keep the data that generated them) I can't pay for them. Still, they would be nice to know about!
I write in British English.
No comments:
Post a Comment
Comments are switched off until the current spam storm ends.