Welcome, miners.
Changelog:
- Nil.
Errorlog:
- Nil.
Notifications:
- Nil.
0. Bad luck all around?
The larger pools - Eligius, GHash.IO, Slush - have been having some terrible luck lately. Ghash.IO has lost about 15Phps of miners over the last four weeks, and Slush has lost about 5 Phps over the last week. I assume there are lots of new miners on those pools that assume past luck is an indicator of future luck.
Strangely though, I read posts by miners who mention that they will move from one of these pools to another one that is having bad luck. Come on! If you're going to fall victim to the Gambler's Fallacy, at least do it properly!
Explanation of the tables and charts
Table 1: Pool reported block history statistics. This
table lists all statistics that can be derived from the number of
blocks a hashrate contributor has solved for the past week using all solved blocks - both valid and orphaned - and difficulty 1 shares per round.
- A much more accurate estimate of the hashrate, confidence intervals are unnecessary.
- Orphan races lost, and percentage of solved blocks that were not added to the blockchain.
- "Luck" is the usual difficulty 1 equivalent shares per round / mining difficulty, or (equivalently) accepted shares / expected shares.
- CDF: The cumulative density function (CDF) measures the percentage of the time this number accepted shares / expected shares would be less than the calculated value, given the number of valid + invalid blocks.
- Pool profitability uses compares variables such as total number of shares in a week and total reward (including transactions) in a week with the expected reward per share. Pool fee is not included.
Since BTC Guild doesn't report shares
per block but does report transaction hashes for all blocks, luck cannot
be calculated but orphaned blocks can be enumerated. Pools that don't
have a public pool interface cannot be included.

Average hashrate per solved block (valid + invalid)
Hashrates
are calculated from the pool reported difficulty-1 equivalent shares
per round and the pool reported block solve times for all solved blocks,
both valid and invalid. Note that BTC Guild is not included since the
difficulty 1 equivalent shares per round data is not reported; instead
use BTC Guild's hashrate chart which has matched my past estimates quite well and which I regard as accurate.

Pool profitability
This
simple pool profitability uses compares variables such as total number
of shares in a week and total reward (including transactions) in a week
with the expected reward per share. Pool fee is not included, but this
is a good basis on which to compare pools, as long as you're aware of
pool fees, whether transaction fees are paid to you, and whether or not
the pool is paying for orphaned blocks.
Obviously
only relevant if the reward method is not PPS; however the charts can
also be interpreted as the profitability of the pool, so it might give
you some insight into the financial health of a PPS pool.

Density of orphaned blocks
This
chart shows the density of orphaned blocks per pool, as a function of
blocks solved by that pool. The fringe indicates the actual occurrences
of the orphaned blocks, and the colour of the line and fringe indicate
the approximate date.
Some orphan data may be missing from Polmine. The rest seem to be correct.

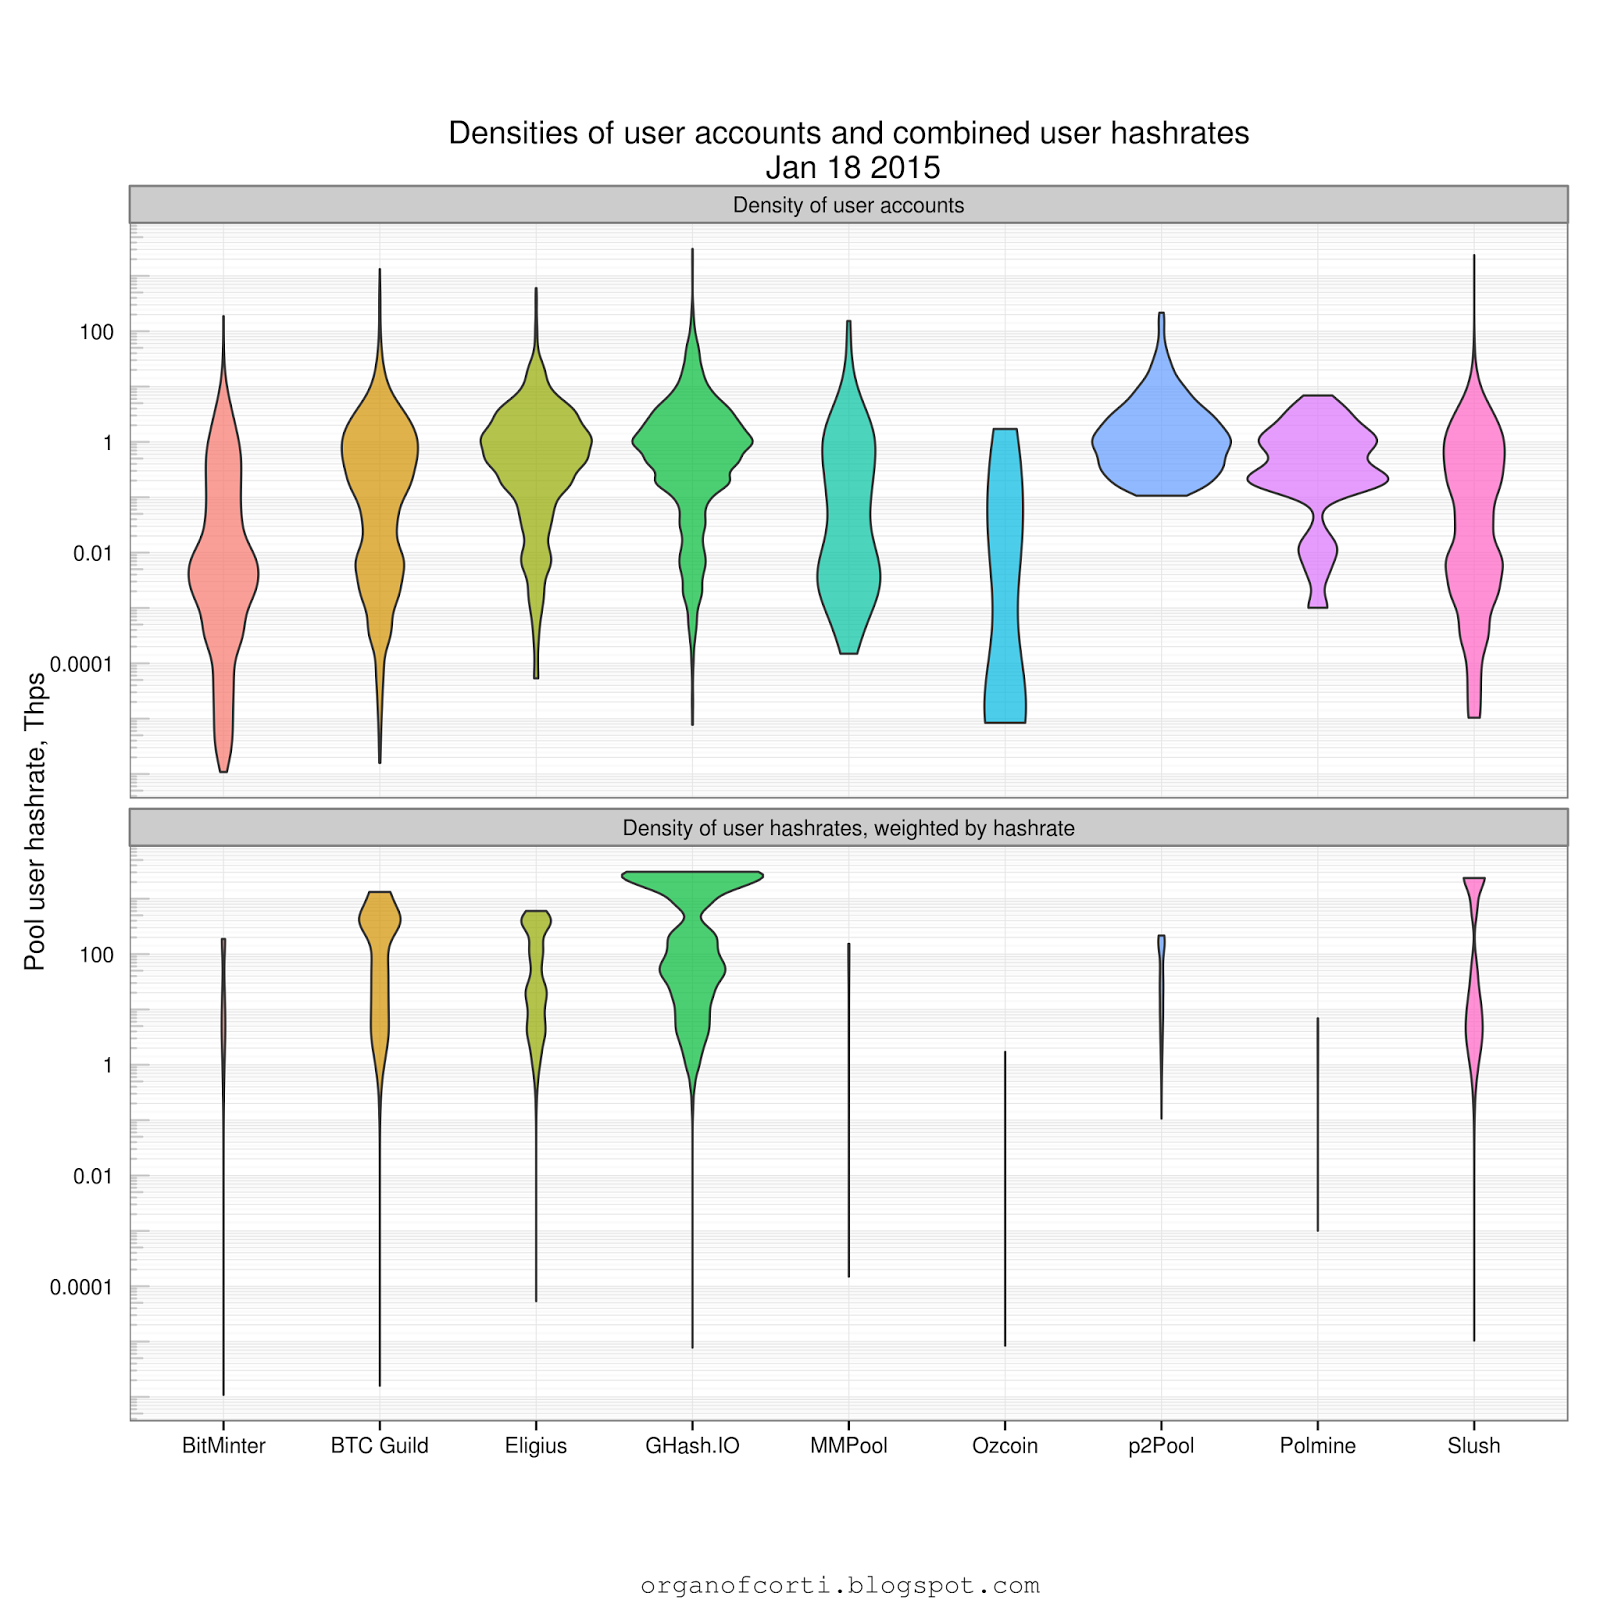
Pool user hashrate and combined user hashrate densities
The
top facet of this chart shows the proportion of user accounts with a
given hashrate - the thicker the "violin" the greater the density of
user accounts with a particular hashrate.
The
bottom facet is the same data, weighted by hashrate. In effect, it
shows what proportion of the pool's hashrate is supplied by particular
hashrates. The area of the "violins" is proportional to their total
hashrate.
Note
that for some pools the hashrate is averaged over twenty four hours,
some pools are averaged over an hour or more and some for only fifteen
minutes, so expect some variance in the results.
#### to be added: stats for Kano's pool
organofcorti.blogspot.com is a reader supported blog:
1QC2KE4GZ4SZ8AnpwVT483D2E97SLHTGCG
Created using R and various packages, especially dplyr, data.table, ggplot2 and forecast.
Thank you to blockchain.info and coinometrics.com for use of their transaction and address data, and coincadence.com for their p2pool miner data.
Find
a typo or spelling error? Email me with the details at
organofcorti@organofcorti.org and if you're the first to email me I'll
pay you 0.01 btc per ten errors.
Please refer to the most recent blog post for current rates or rule changes.
I'm terrible at proofreading, so some of these posts may be worth quite a bit to the keen reader.
Exceptions:
- Errors in text repeated across multiple posts: I will only pay for the most recent errors rather every single occurrence.
- Errors in chart texts: Since I can't fix the chart texts (since I don't keep the data that generated them) I can't pay for them. Still, they would be nice to know about!
I write in British English.

`
No comments:
Post a Comment
Comments are switched off until the current spam storm ends.