Welcome, miners.
Changelog:
- Kano's pool (thanks readers) and BTC China Pool added.
- Slush's pool added to weekly hashrate distribution.
Errors:
- Discus Fish still seem to update their data irregularly. Until they update more regularly, their data in the second table, and for figure 4, 5 and 7 will only be based on that subset.
Notifications:
- Nil.
0. Eleuthria is not calling it a day.
The day after I reported that Eleuthria would be leaving pooled mining, he posted that he was attempting to move BTC Guild and possibly get some help running it. I'm sure we are all glad to hear that.
1. Kano's pool and BTC China pool added
If anyone has knows how to identify other pools I am not currently reporting on, please post in the comments or email me.
2. Slush's pool added to miner hashrate distribution.
Pavel from Slush's pool kindly gave me access to (anonymised) miner hashrate distribution data. This is a huge help since miner hashrate distributions allow us to make inferences about the health of the network in general, and the more of the network I know about, the better the network health indicators can be.
I just need to get Discus Fish on board and I'll have enough of the network's hashrate distribution to use confidently.
Explanation of the tables and charts
Table 1: Solved block statistics. This table lists all statistics that can be derived from the number of blocks a hashrate contributor has solved for the past week. Block attributions are either from primary sources such as those claimed by a particular pool website, or secondary sources such as coinbase signatures, or known generation addresses. When dependent on secondary sources only, data may be inaccurate and miss some blocks if a particular block-solver has gone to some trouble to hide solved blocks. This will result in an underestimate of the block-solver hashrate.
Note that actual pool hashrates when derived from shares submitted per unit time will be more accurate than the hashrate estimates given in this table.
"Unknown" is not an entity but the group of blocks to which I cannot give attribution using the methods given above. "BitAffNet" is Bitcoin Affiliate Network.
It should be noted that although I update regularly, I don't correct old posts.

Table 2: Pool reported block history statistics. This table lists all statistics that can be derived
from the number of blocks a hashrate contributor has solved for the
past week using all solved blocks - both
valid and orphaned - and difficulty 1 shares per round.

The table below includes unknown addresses that have been reused ever.
Figure 1: Pie chart of the percentage of network blocks by pool A visual representation of the "Percentage of network" data aggregated in table 1.

Figure 2: 51% attack chart Historical hashrates of the bitcoin network, the largest mining pool, the three largest mining pools combined, and a line representing 50% of the network hashrate. Handy if you're worried about 51% attacks. Hashrates are all estimated from blocks solved, and the history goes back to the earliest date the data contains three known pools. Some pool data may be missing from the earliest data points. The upper and lower 95% confidence interval bounds for the network hashrate are in between the shaded areas.

Figure 3: Percentage of blocks solved each week for the current top ten contributors
Data is calculated from the number of blocks each contributor added to the blockchain during the week. The points are the actual data; the lines are exponentiated smoothing splines of the log of the data.
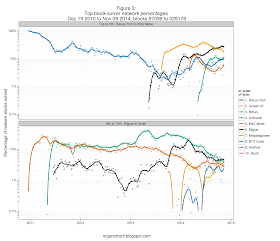
Figure 4: Average hashrate per solved block (valid + invalid)
Hashrates are calculated from the pool reported difficulty 1 equivalent shares per round and the pool reported block solve times for all solved blocks, both valid and invalid. Note that BTC Guild is not included since the difficulty 1 equivalent shares per round data is not reported; instead use BTC Guild's hashrate chart which has matched my past estimates quite well and which I regard as accurate.

Figure 5: Pool "luck" (valid + invalid solved blocks)
The orange dots are the usual accepted shares / expected shares (equivalently, shares per round / network Difficulty). The background colours are accepted shares / expected shares confidence intervals for the number of blocks solved for the week. The greater the number of blocks solved (the higher the percentage of the network) the narrower the bounds.
The "luck" data points should be outside the upper or lower boundaries only rarely. Many data points outside this range indicate unusual and unlikely "luck".
Data only goes back for the last twelve months at most - any more data points than this becomes hard to read, and recent data is most important.
Note that all solved blocks are used, otherwise the data would no longer be Erlang distributed and a CDF could not be calculated.

Figure 6: Pool user hashrate and combined user hashrate densities
The top facet of this chart shows the proportion of user accounts with a given hashrate - the thicker the "violin" the greater the density of user accounts with a particular hashrate.
The bottom facet is the same data, weighted by hashrate. In effect, it shows what proportion of the pool's hashrate is supplied by particular hashrates. The area of the "violins" is proportional to their total hashrate.
Note that for some pools the hashrate is averaged over twenty four hours, some pools are averaged over an hour or more and some for only fifteen minutes, so expect some variance in the results.

Figure 7: Density of orphaned blocks
This chart shows the density of orphaned blocks per pool, as a function of blocks solved by that pool. The fringe indicates the actual occurrences of the orphaned blocks, and the colour of the line and fringe indicate the approximate date.
Some orphan data may be missing from Polmine. The rest seem to be correct.

Organofcorti lives!
organofcorti.blogspot.com is a reader supported blog:
1QC2KE4GZ4SZ8AnpwVT483D2E97SLHTGCG
Thank you to blockchain.info and coinometrics.com for use of their transaction and address data, and coincadence.com for their p2pool miner data.
Find a typo or spelling error? Email me with the details at organofcorti@organofcorti.org and if you're the first to email me I'll pay you 0.01 btc per ten errors.
Please refer to the most recent blog post for current rates or rule changes.
I'm terrible at proofreading, so some of these posts may be worth quite a bit to the keen reader.
Exceptions:

<weeklypoolstatistics>
Table 1: Solved block statistics. This table lists all statistics that can be derived from the number of blocks a hashrate contributor has solved for the past week. Block attributions are either from primary sources such as those claimed by a particular pool website, or secondary sources such as coinbase signatures, or known generation addresses. When dependent on secondary sources only, data may be inaccurate and miss some blocks if a particular block-solver has gone to some trouble to hide solved blocks. This will result in an underestimate of the block-solver hashrate.
Note that actual pool hashrates when derived from shares submitted per unit time will be more accurate than the hashrate estimates given in this table.
"Unknown" is not an entity but the group of blocks to which I cannot give attribution using the methods given above. "BitAffNet" is Bitcoin Affiliate Network.
It should be noted that although I update regularly, I don't correct old posts.

- A much more accurate estimate of the hashrate, confidence intervals are unnecessary.
- Orphan races lost, and percentage of solved blocks that were not added to the blockchain.
- "Luck" is the usual difficulty 1 equivalent shares per round / mining difficulty, or (equivalently) accepted shares / expected shares.
- CDF: The cumulative density function (CDF) measures the percentage of the time this number accepted shares / expected shares would be less than the calculated value, given the number of valid + invalid blocks.
- Bitcoin per Gigashare. This figure is not an indicator of how much a miner should have expected per one billion Difficulty 1 shares (or one thousand difficulty megashares, etc), since it doesn't take into account the reward method or fees charged. Rather, it should be considered as a "luck" index that also incorporates the number of orphaned blocks and the current reward per block.

Table 3: Reused but unknown generation addresses
Unknown
generation addresses that are not reused are probably solominers or
private mining concerns that don't have share-holders wanting to follow
transactions. However, reused addresses are probably from hash
contributors that do not wish to remain anonymous. These need to be
identified so they can be removed from the "Unknown" group. I'm not
interested in identifying those who wish to remain completely anonymous,
so I'm not trying to trace originating IP addresses (as Blockchain.info does).The table below includes unknown addresses that have been reused ever.
| Unknown recurring generation address | Blocks solved this week | Percentage of network | Percentage of unknown | Estimate of hashrate | Blocks solved ever |
|---|---|---|---|---|---|
| 1GcF7j3YH8Qs8hvNEe7zbrQZftMU6sRLfu | 25 | 2.31 % | 23.36 % | 6620 Thps | 310 |
| 1Da2sowBmfycW9Fk2YnxujTt4s8aUAjHpW | 13 | 1.20 % | 12.15 % | 3322 Thps | 13 |
| 1CAYZEt8XqiZVn5qKBMjNyDmuRvpmT6WJs | 12 | 1.11 % | 11.21 % | 3067 Thps | 12 |
| 1CvkgLUwaL5XgxgJCdvHceteXKGSvcoGkV | 12 | 1.11 % | 11.21 % | 3375 Thps | 12 |
| 16UZP8BceDPs4J5me5SAJVCHbmVBbEcXMD | 10 | 0.93 % | 9.35 % | 2812 Thps | 10 |
| 15AboNepu664f4dUzdEfFDCRXX5bVgAAaq | 9 | 0.83 % | 8.41 % | 2351 Thps | 9 |
| 1BwZeHJo7b7M2op7VDfYnsmcpXsUYEcVHm | 7 | 0.65 % | 6.54 % | 1917 Thps | 70 |
| 1B1s7aMVnebRrNSetDnd5BEGoPyLGMCzJ9 | 5 | 0.46 % | 4.67 % | 1406 Thps | 7 |
| 1PhUMRvEZQVhBHhxpHPBqC1aVwR3XTWSEo | 5 | 0.46 % | 4.67 % | 1406 Thps | 5 |
| 1PXWcw9pedrnY4SvDWf8iegQwkepE4vAw3 | 3 | 0.28 % | 2.80 % | 767 Thps | 7 |
| 1qtKetXKgqa7j1KrB19HbvfRiNUncmakk | 2 | 0.19 % | 1.87 % | 562 Thps | 11 |
| 14NAii2msCkJMgkckeQjcT2yeVAuCDt9FR | 1 | 0.09 % | 0.93 % | 256 Thps | 2 |
Figure 1: Pie chart of the percentage of network blocks by pool A visual representation of the "Percentage of network" data aggregated in table 1.

Figure 2: 51% attack chart Historical hashrates of the bitcoin network, the largest mining pool, the three largest mining pools combined, and a line representing 50% of the network hashrate. Handy if you're worried about 51% attacks. Hashrates are all estimated from blocks solved, and the history goes back to the earliest date the data contains three known pools. Some pool data may be missing from the earliest data points. The upper and lower 95% confidence interval bounds for the network hashrate are in between the shaded areas.

Figure 3: Percentage of blocks solved each week for the current top ten contributors
Data is calculated from the number of blocks each contributor added to the blockchain during the week. The points are the actual data; the lines are exponentiated smoothing splines of the log of the data.

Figure 4: Average hashrate per solved block (valid + invalid)
Hashrates are calculated from the pool reported difficulty 1 equivalent shares per round and the pool reported block solve times for all solved blocks, both valid and invalid. Note that BTC Guild is not included since the difficulty 1 equivalent shares per round data is not reported; instead use BTC Guild's hashrate chart which has matched my past estimates quite well and which I regard as accurate.
Figure 5: Pool "luck" (valid + invalid solved blocks)
The orange dots are the usual accepted shares / expected shares (equivalently, shares per round / network Difficulty). The background colours are accepted shares / expected shares confidence intervals for the number of blocks solved for the week. The greater the number of blocks solved (the higher the percentage of the network) the narrower the bounds.
The "luck" data points should be outside the upper or lower boundaries only rarely. Many data points outside this range indicate unusual and unlikely "luck".
Data only goes back for the last twelve months at most - any more data points than this becomes hard to read, and recent data is most important.
Note that all solved blocks are used, otherwise the data would no longer be Erlang distributed and a CDF could not be calculated.
Figure 6: Pool user hashrate and combined user hashrate densities
The top facet of this chart shows the proportion of user accounts with a given hashrate - the thicker the "violin" the greater the density of user accounts with a particular hashrate.
The bottom facet is the same data, weighted by hashrate. In effect, it shows what proportion of the pool's hashrate is supplied by particular hashrates. The area of the "violins" is proportional to their total hashrate.
Note that for some pools the hashrate is averaged over twenty four hours, some pools are averaged over an hour or more and some for only fifteen minutes, so expect some variance in the results.

Figure 7: Density of orphaned blocks
This chart shows the density of orphaned blocks per pool, as a function of blocks solved by that pool. The fringe indicates the actual occurrences of the orphaned blocks, and the colour of the line and fringe indicate the approximate date.
Some orphan data may be missing from Polmine. The rest seem to be correct.

Organofcorti lives!
organofcorti.blogspot.com is a reader supported blog:
1QC2KE4GZ4SZ8AnpwVT483D2E97SLHTGCG
Thank you to blockchain.info and coinometrics.com for use of their transaction and address data, and coincadence.com for their p2pool miner data.
Find a typo or spelling error? Email me with the details at organofcorti@organofcorti.org and if you're the first to email me I'll pay you 0.01 btc per ten errors.
Please refer to the most recent blog post for current rates or rule changes.
I'm terrible at proofreading, so some of these posts may be worth quite a bit to the keen reader.
Exceptions:
- Errors in text repeated across multiple posts: I will only pay for the most recent errors rather every single occurrence.
- Errors in chart texts: Since I can't fix the chart texts (since I don't keep the data that generated them) I can't pay for them. Still, they would be nice to know about!

<weeklypoolstatistics>
No comments:
Post a Comment
Comments are switched off until the current spam storm ends.