25th September 2015
Related posts:
BIP101 implementation flaws
Supermajority and BIP101 activation
0. Introduction
In the two posted listed above, I discussed some issues regarding the way blockchain voting is implemented in BIP101, and that is to assess the proportion of blocks voting for BIP101 over the past one thousand blocks, and to repeat the test each and every block.
However, it's not just a problem for BIP101 - any proposal on which block makers can vote will face similar problems if they use the same method. My proposal was to assess the proportion of voting blocks once two thousand and sixteen blocks - just when the new difficulty is calculated.
Current method
After every new block:
- Count the proportion of the past one thousand blocks (including the current new block) which contain the "pro" vote identifier.
- If the observed proportion is greater than or equal to a predefined limit, the proposal succeeds.
- There may not be a defined end to the voting period.
Proposed method
When blockheight mod 2016 = 0 (i.e. at each retarget):
- Count the proportion of the past two thousand blocks (including the current new block) which contain the "pro" vote identifier. This means that the first sixteen blocks since the last assessment are discarded.
- If the observed proportion is greater than or equal to a predefined limit, the proposal succeeds.
- The last voting block is defined as part of the voting protocol.
Here's a short list of the advantages of the proposed over the current voting methods.
1. Low cost of change
As far as I can tell, for any new BIP, a change to the proposed voting protocol would be trivial.
2. Intuitive - uses a testing cycle "native" to bitcoin.
If you ask a miner what difficulty is, and how often it is assessed and how it changes, they'll be able to explain it to you in detail. Miners need to understand how difficulty changes their earning capacity. Block makers will be even more sensitive to changes in difficulty since they may have rather more at stake.
The difficulty retarget every 2016 blocks is the "heart beat" of bitcoin. Why would a voting cycle use any other frequency?
3. An end date to voting improves accuracy
Not having an end date for voting means that either the proposal is passed, or that voting continues indefinitely. This is asymmetric - the vote can never fail, just never pass. Each test, the chance of a low true proportion activating a proposal becomes much greater.
4. Sample proportion has a well known and understood probability distribution.
Under the proposed method, the sample proportion has a binomial probability distribution - a probability distribution that has been investigated for hundreds of years. The current method is a rolling sum of voting blocks and each test is not independent of the last. I don't doubt there is a way of modelling this, but if so it's not well known or tested.
For something as important as voting, I'd want to use a method that is widely taught, easily understood and has plenty of tools to analyse it. If you pick a supermajority - say 66% - then you should be able to also determine the confidence intervals for the supermajority.
5. More accurate.
Using two thousand as opposed to one thousand blocks to test the proportion of voters will result in a more accurate estimate of the true proportion of voters based from the observed proportion of voters. The distribution of the true proportion can be estimated using the beta distribution. The chart below compares the probability density at the first voting measurement:

The current method clearly has a greater spread of values - and is less accurate.
6. More reliable.
Not only is the proposed method more accurate, but because the frequency of testing is significantly reduced, it's more reliable. Four thousand and thirty two blocks after the first test the current voting method will have tested the proportion of voters four thousand and thirty two times. Under the proposed method, only three such tests would have taken place. Every test of proportion that is made increases the probability that a larger observed proportion will result from a smaller true proportion.
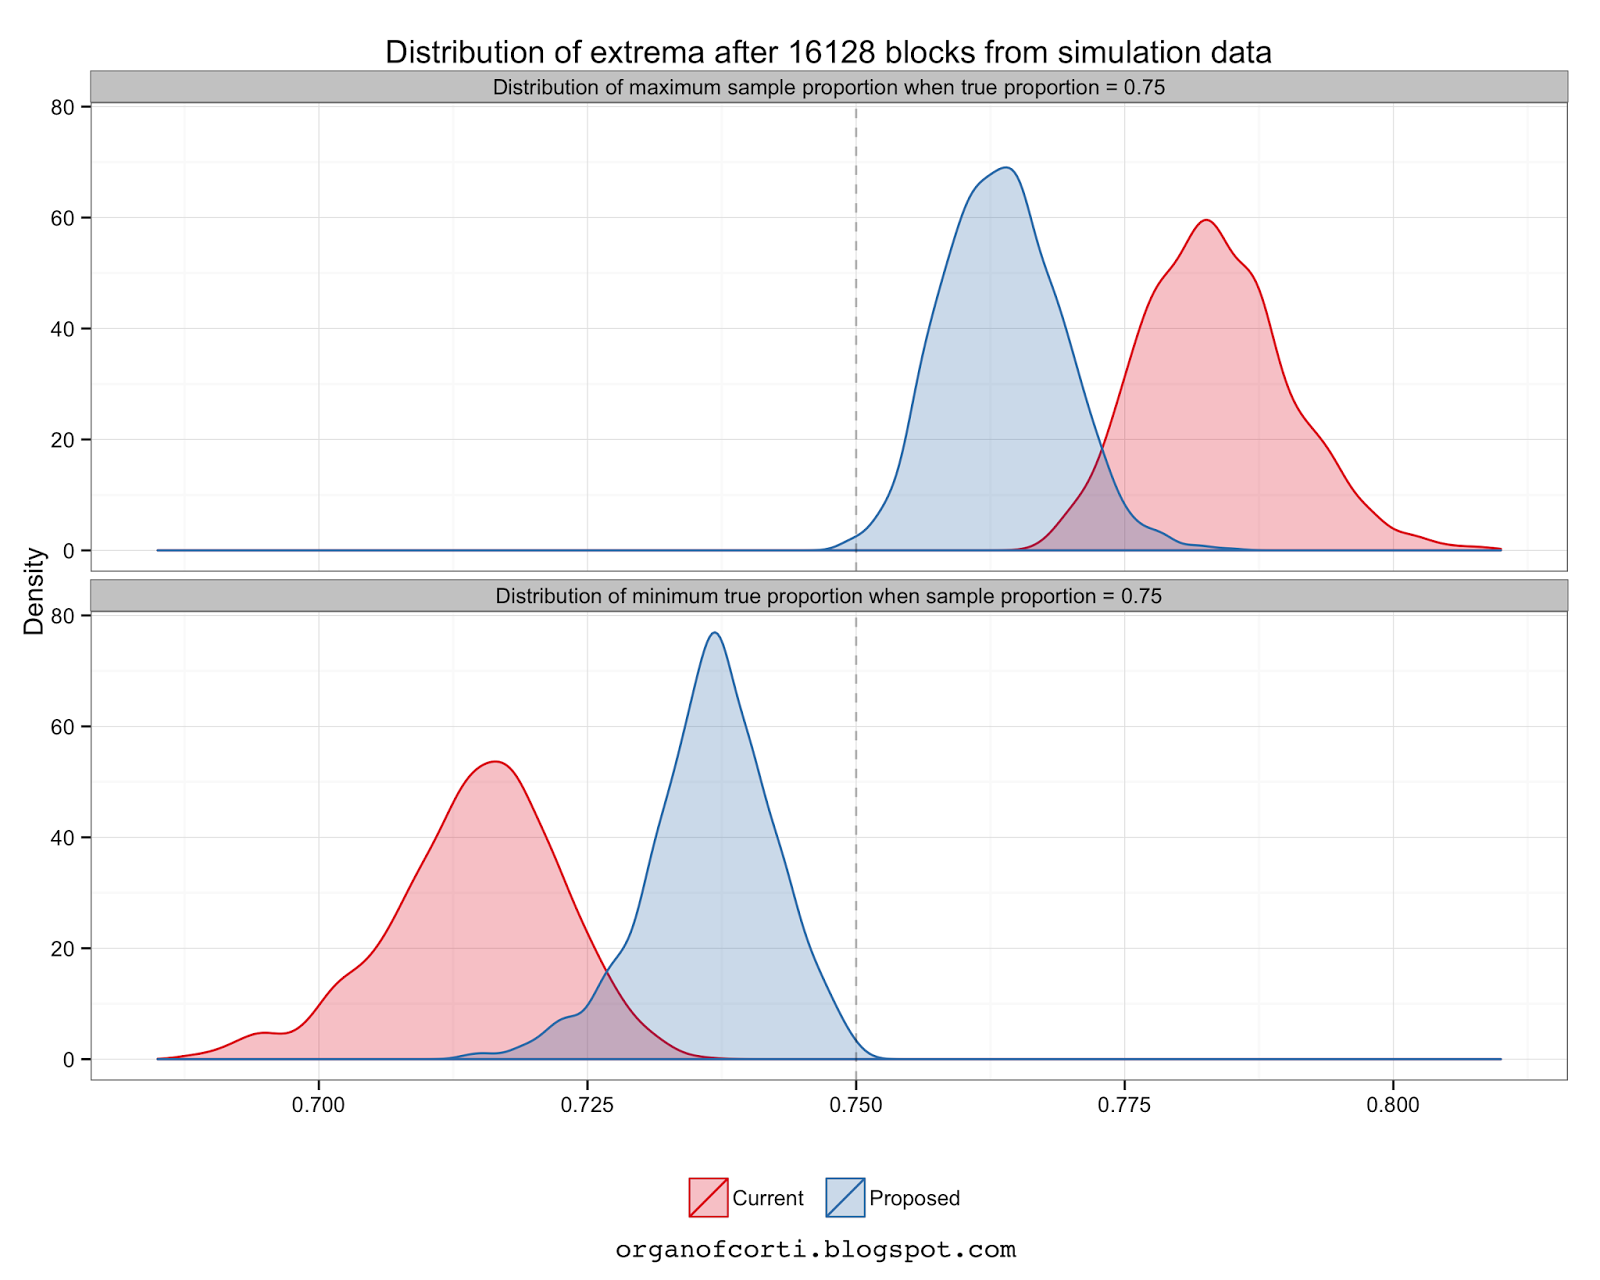
A way of showing this is to illustrate the differences in the distribution of the maximum observed proportion for a given true proportion, and the distribution of the minimum true proportion for a given observed proportion. This can be done several ways - fitting to a generalised extreme value distribution, for example - but for ease of use I prefer to again use the beta probability distribution to find the quantiles of the first and last order statistics of a given size group. Unfortunately, although we can do this for the proposed voting method, the current voting method can only be simulated. So I can compare the two evenly, I've simulated them both using the same strings of random data, as follows:
- Generate forty thousand binomially distributed random variables with constant probability and size = 1 (i.e. a series of zeros and ones, the proportion of ones determined by the probability of occurrence)
- To generate the random variates for the current method, discard the first thousand variables, then calculate the one thousand block moving sum.
- To generate the random variates for the proposed method, discard the first sixteen variables, then calculate the two thousand block sliding window sum, where the window of summation moves two thousand and sixteen blocks between sums.
In case you might be thinking that this might not be the case for other true proportions and numbers of tests, I've plotted the mean and 95% confidence intervals for the true proportions for a given observed (or sample) proportion:

32256 blocks after the first one, the current method has had 32256 further tests and has a minimum true proportion distribution which 0.03 to 0.06 less than expected when the observed proportion is 0.6.
In the same circumstance the proposed method has only had sixteen further tests, and has a 95% confidence interval for the minimum true proportion of 0.01 to 0.03 less than the observed or sample proportion.
Generally, the proposed method has a minimum true proportion that is much closer to the sample proportion - meaning that results determined this way are more reliable.
6. Summary
The blockchain voting method I've outlined here is clearly preferable to the current method:
- Uses bitcoin's "heart beat" as the the testing frequency - calculations per retarget are a part of the protocol for calculating difficulty.
- Can be modelled numerically, without resorting to a Monte Carlo simulation.
- Has an end date.
- More accurate.
- More reliable.
Given the extremely low cost of change, why would you not conduct blockchain voting using the method proposed in this post?
Maybe I've missed something - let me know if you think I have, or if you think this is a good idea.
organofcorti.blogspot.com is a reader supported blog:
1QC2KE4GZ4SZ8AnpwVT483D2E97SLHTGCG
Created using R and various packages, especially dplyr, data.table, and ggplot2.
Find a typo or spelling error? Email me with the details at organofcorti@organofcorti.org and if you're the first to email me I'll pay you 0.01 btc per ten errors.
Please refer to the most recent blog post for current rates or rule changes.
I'm terrible at proofreading, so some of these posts may be worth quite a bit to the keen reader.
Exceptions:
- Errors in text repeated across multiple posts: I will only pay for the most recent errors rather every single occurrence.
- Errors in chart texts: Since I can't fix the chart texts (since I don't keep the data that generated them) I can't pay for them. Still, they would be nice to know about.
I write in British English.

It seems to be as though a great portion of the results showing better performance from this algorithm is simply a result of using 2016 blocks instead of 1000, not so much the rolling average versus per-step sampling. There probably is also some component from the fact that checks are done less often, but you should consider redoing the tests with a 2016 block period vs a 2016 block moving average so that you can isolate that particular effect.
ReplyDeleteI personally prefer just using exponential moving averages for everything as they are almost completely memoryless (they do not ever require looking at anything other than the latest block); if you have concerns about sampling extrema then just upping the factor from 1000 to 5000 seems reasonable. A slow EMA also has the property that people can have certainty that a protocol change will NOT be implemented until a particular calculable point in time, which seems useful for software developers.
That said, if bitcoin is organized around a 2016 block heartbeat then it does seem reasonable to organize things around that for that reason alone; ethereum is entirely EMA-based hence my preference for sticking anything else in an EMA as well. At the end of the day imo it really does not matter that much.
> each test is not independent of the last
There is a slight dependence from the "zero stale rate after mining the last block" effect but it's not large; I think it's fair to consider each block an independent random sample.
Hi Vitalik,
DeleteI'm writing a post in response - I couldn't fit my reply into a comment. Could you link me to the exact type of EMA used for ethereum?
I've updated the post here:
Deletehttp://organofcorti.blogspot.com/2015/11/blockchain-voting-and-comment-response.html