Changelog:
- Nil.
Errorlog:
- Nil.
Notifications:
- Nil.
0. International distribution of network block makers
There is some concern that if too much of the network security resides in a particular country, it may be possible for that country's government to exert an influence on the network. It would be useful to have some sort of centralisation metric to measure this, or even just some sort of pie chart.
However I'm having trouble deciding on the data to use for attribution. Options:
- Use the nation in which a block maker is incorporated.
- Use the nation in which the servers are located.
The advantage of the former is that the information should be fairly simple to obtain, and if a company is incorporated in a particular nation, then that nation may have legal claims over that entity, even if it is not resident in the country of incorporation.
On the other hand, it is possible to estimate the hashrate of servers resident in any particular country by looking up the server IP address geolocation, which is quite probably the location of the actual servers which create and propagate blocks. However to do this programatically would mean using other people's data which I am somewhat loathe to do. Plus, I'm not completely certain about how farms manage their servers, and whether for example some might use a VPN which might obscure their server locations.
I think to at least make a start, the simpler former method is probably better. What do you think? Leave a comment if you have any ideas, and if you know the country in which a particular block maker is incorporated, please mention it in the comments and link to the proof.
1. Median and mean block sizes have increased significantly
Block sizes had stalled at an average of 400
2. Mean tx fee and block size have doubled since mid-2014
Transaction fees have doubled since mid-2014. Since block size has also doubled over the same period, we can be fairly confident that the rate of fee-free and low-fee transactions haven't been increasing at a greater rate. So if you see a consistent increase in spam included in blocks, it could be just keeping pace with commercial transactions rather than increasing at a faster rate.
The network hashrate
The plots below show the network hashrate since block height 1, for the last year and for the last six months. The mean estimate is calculated using the daily average hashrate.

The second and third charts also include confidence intervals for the hashrate, the mean hashrate estimate, and a 28 day forecast estimate.
- The dashed line is the mean hashrate estimate.
- The grey shaded area is the 95% confidence interval for the mean hashrate estimate.
- The dotted line is the 95% confidence interval for daily hashrate averages, given the mean hashrate estimate, so 95% of the large grey dots (average daily hashrate) should be within the dotted line.
- The blue shaded areas are the confidence intervals for the forecast.
- Forecast confidence intervals are bootstrapped.
You notice that the mean forecast is not given - just the confidence intervals. The reason for this is that in the past people have focussed on the mean forecast, but I think the range of values the network hashrate could take is much more important.


Miner profitability and forecast
- The first plot below shows the weekly miner income and cumulative miner income for the past 52 weeks.
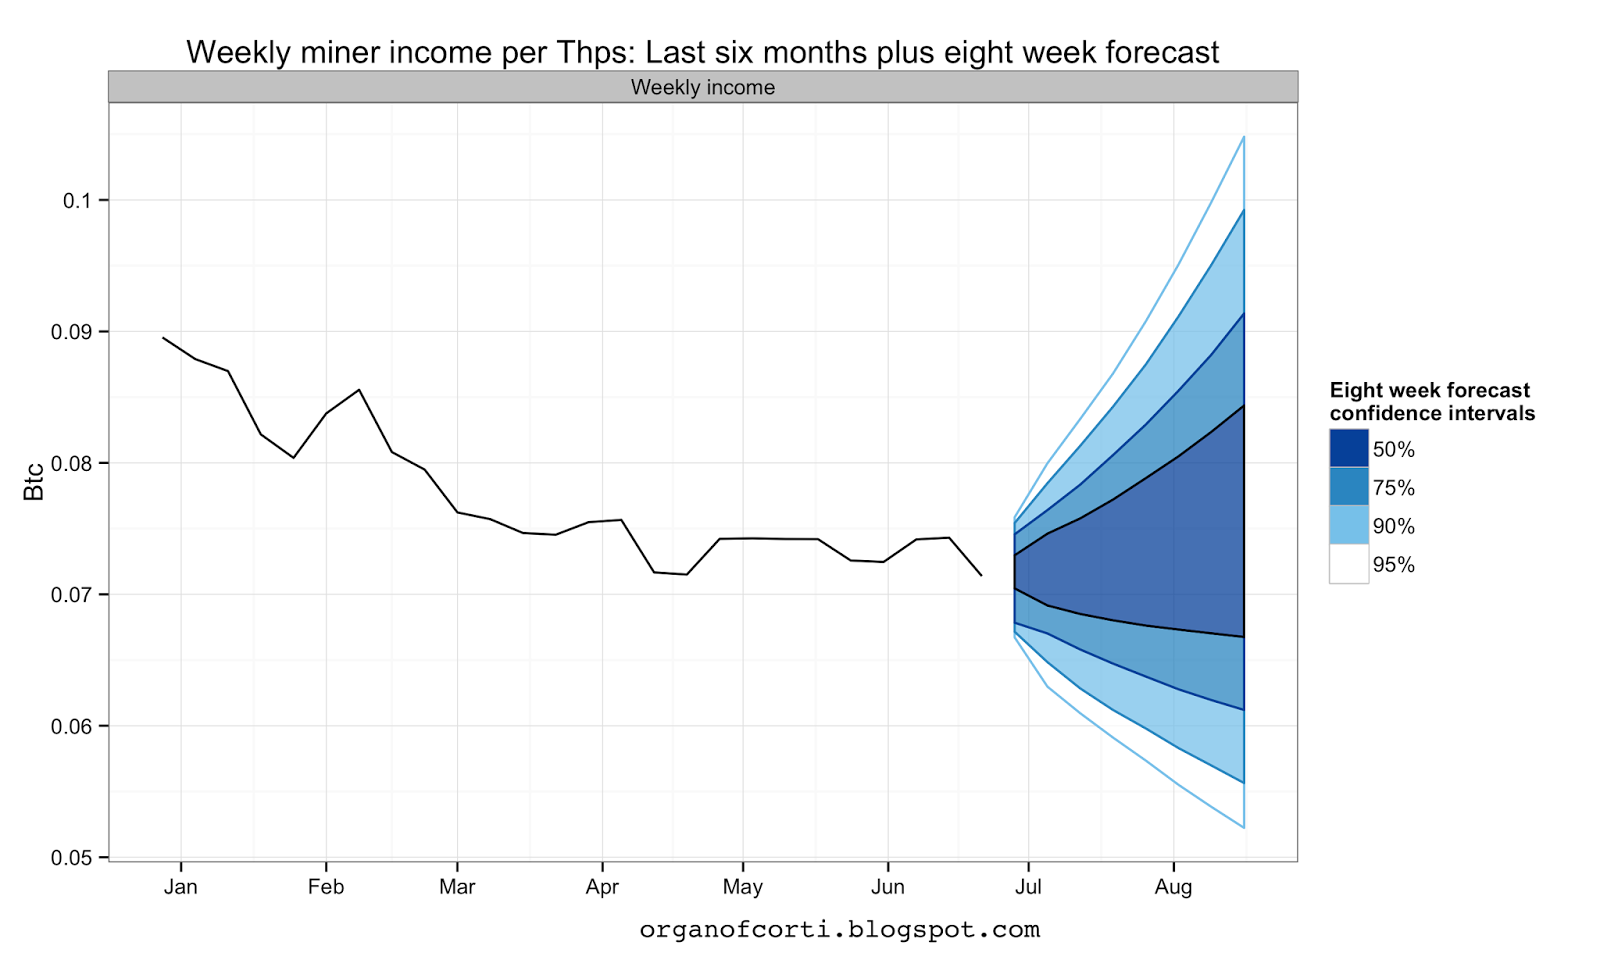
- The second plot shows the weekly miner income for the past 26 weeks with an eight week forecast.
- The third plots shows the cumulative miner income eight week forecast.
- Forecast confidence intervals are bootstrapped.
Again, the mean forecast is not given for the same reasons I gave previously. Eight weeks forecast is possible as these are weekly summary statistics; for daily summary statistics (such as above) only four weeks forecast is possible with any accuracy.


Transaction fees
Transaction fees are often overlooked by miners but will become very important for them - as the block reward decreases, transaction fees must necessarily go some way toward ameliorating the loss in block reward.
However, as can be seen in the top facet of the second plot below the transaction fees per block are not increasing - or even maintaining - a percentage of the block reward.
The lower facet plots the percentage of the maximum possible block size used.


Estimated mean and median miner hashrate
This estimate is actually the average and median percentage of the network contributed by each miner.
Standard error has been calculated using bootstrapping resampled data, and is shown by the shaded area.

Estimated number of miners
The known number of miners is calculated using the miner hashrate distribution that some pools provide. It is shown by the dashed line, colour indicating the percentage of the network that those miners make.
The estimated number of miners uses a model to estimate the number of miners at pools that do not provide such data. I will be attempting to optimise the model regularly, so this week's plot may not be the same as last week's.
Standard error for the estimate has been calculated using bootstrapping resampled model data, and is shown by the shaded area.

Inequality measures
General inequality between block makers (facet 1)
Previously, I have described inequality measures. The two general inequality measures, the Gini coefficient and the Theil index, measure inequality between blocks block makers. They are minimised when all block makers solve a similar number of blocks over a period of time and maximised if only one of many block makers solves all the blocks for a given period of time (since we know that bitcoin mining is a stochastic process in which variance can be significant, a reasonable time period should be chosen).
The Herfindahl index theoretically captures the equivalent share that would be enjoyed by equal-sized firms in the marketplace.
The Herfindahl index theoretically captures the equivalent share that would be enjoyed by equal-sized firms in the marketplace.
Inequality between groups: smaller block makers and larger block makers (facet 2)
I'm using two ways to illustrate inequality between the half of the network with the highest concentration of hashrate, and the half of the network with the lowest concentration of hashrate.
Mining centralisation index = 1 - mean(Sblocks) / mean(Lblocks)
Sblocks = number of blocks solved by small block makers
Lblocks = number of blocks large by large block makers
This index is measuring the inequality between two groups: the half of the network with the highest concentration of hashrate, and the half of the network with the lowest concentration of hashrate. It can be interpreted as:
Large to small density ratio = 1 / (1 - centralisation index)
For example an index of 80% means that the average larger pool has 1 / (1 - 0.8) = 5 times greater proportion of the network than the average smaller pool.
Mining centralisation index 2 = Sh * (log(Sh) - log(Sn)) + Lh * (log(Lh) - log(Ln))
Sh = Sblocks/(Sblocks + Lblocks)
Sn = No. small pools/(No. small pools + No. large pools)
Lh = Lblocks/(Sblocks + Lblocks)
Ln = No. large pools/(No. small pools + No. large pools)
This also has a range from maximum equality at 0 to maximum inequality at 1, but does not have an intuitive meaning (except that lower is better).
Below the two general and two grouped inequality measures have been plotted. The Gini coefficient and the Theil index are quite similar, and the Mining centralisation indices 1 and 2 also are quite similar.

General inequality between block makers: Gamma diversity
The Gamma diversity with q = 2 is equal to the inverse of the Herfindahl Index, and in this case equals the equivalent number of competitive firms.

Inequality between groups: Public mining pools and non pool block makers.
Another concern many people have is that public mining pools have a decreasing share of the network. Public mining pools are reliant on miners in order to make blocks and distribute rewards, and a pool with fewer miners has greater income variance.
This means that if a pool was doing something to the block chain that miners don't like (anything from incorporating graffiti into the block chain - some of my favourite graffiti here - to Selfish Mining), miner could choose to leave the pool. Non pool block makers might have fewer restrictions on their actions, which could be a problem for the network.
There are a number of different ways to analyse this, but I went with something quite simple:
Public mining pools % network = P / N
P = no. of blocks attributable to public mining pools in some period of time
N = no. of blocks solved by network in same period of time.
This is quite simple to understand. If you worry about mining pools disappearing, then the fact the line is slowly heading toward 50% won't help you sleep at night.

organofcorti.blogspot.com is a reader supported blog:
1QC2KE4GZ4SZ8AnpwVT483D2E97SLHTGCG
Created using R and various packages, especially dplyr, data.table, ggplot2 and forecast.
Recommended reading:
- For help on ggplot2.
- For help on forecasting.
Thank you to blocktrail.com for use of their address data, and coincadence.com for their p2pool miner data.
Find a typo or spelling error? Email me with the details at organofcorti@organofcorti.org and if you're the first to email me I'll pay you 0.01 btc per ten errors.
Please refer to the most recent blog post for current rates or rule changes.
I'm terrible at proofreading, so some of these posts may be worth quite a bit to the keen reader.
Exceptions:
- Errors in text repeated across multiple posts: I will only pay for the most recent errors rather every single occurrence.
- Errors in chart texts: Since I can't fix the chart texts (since I don't keep the data that generated them) I can't pay for them. Still, they would be nice to know about!
I write in British English.

400Mb and 500Mb blocks? And here there's people worried about 20MB blocks ;)
ReplyDeleteI suspect that was supposed to be KB - and yes, a few pools have increased their maximum (up from a 750KB default), plus recent 'stress tests' might have made for a few more-filled blocks as well.
Argh! Alright, what's a few orders of magnitude here or there? I'll be if this was a astrophysics blog you wouldn't have noticed! :)
DeleteThanks for pointing that out, fixed now.
As to the block jurisdictional coverage.. yes, that would be quite difficult.
ReplyDeleteTake BitFury...
There's BitFury Group, Ltd. which I have no idea where that is actually registered. There's BitFury Holding BV and BitFury R&D BV that are registered in Amsterdam. Then there's Bitfury USA, Inc. which is registered in San Francisco. Then there's BitFury Capital, but that's specifically their investment branch. There's a further office in Riga doing I have no idea what - probably making the look of disapproval at HashCoins.
Then they have mines in Iceland, Georgia and possibly still in Finland as well. None of which point to either The Netherlands OR the U.S. in terms of jurisdiction, but are very likely going to be subject to the jurisdictions applicable in those countries and areas as well.
Then there's the laws themselves. U.S. laws are generally interpreted as "all your base are belong to us". I.e. it doesn't matter that they might have a business registration in Amsterdam and a mine in Georgia - if they have a presence in the U.S. and if the companies are legally bound together, the U.S. government asserts jurisdiction over goings-on with those as well.
There's a recent-ish thread over on BitcoinTalk about something related, 'tagging' coins with their origin (specifically to single out Chinese mines over perceived treatment of workers there). Ultimately that's a slightly simpler question to answer with simpler way to evade (as you already mentioned: VPN), but it comes with much of the same pitfalls in terms of trying to determine what entity other than the block maker has leverage over making those blocks.
It's a daunting task at best :)
OK, I think you make a good case that using legal documents to determine which country might be able to nationalise a given block maker is just not useful. I'm not keen on "tagging" coins - I'm not happy with anything that can affect the fungibility of bitcoin. However geolocating the IP addresses of the IP address first reporting a block is not really "tagging", I guess, and I'd have to just ignore the possibility of a VPN.
ReplyDeleteI'm not sure exactly how to do it. You need to have a network monitor that can connect to the majority of clients but bit nodes.org is doing just that and has an API, so I can use that instead. Then you use some method to determine which IP addresses actually belong to a particular block maker. This is easy to understand intuitively, but I haven't decided how I'd do it in provably.
Any ideas?
IP addresses are at least likely to be your best bet in terms of getting close to the origin. I don't think things have quite gotten to the point yet where a large miner will use a fat pipe to a VPN with a fat pipe of its own to reach as many nodes as possible as quickly as possible. Probably will, eventually.
DeleteI don't think there is any way to do it provably unless whois information for an IP address matches up with a suspected miner's identity - but most whois results are censored these days ('privacy guard' et al) and can certainly be lied about. You're pretty much stuck with some of the correlation methods previously discussed. I.e. IP address X tends to show up 90% of the time for blocks with this particular characteristic, and 0% of the time for any other blocks, so while it's impossible to know for sure it's the IP address of the miner('s node), we're pretty confident that it either is, or at least is very well-connected to it. I've done that before to look at some of the unknown blockmakers, and when you end up at an IP address that's linked to picostocks.com or one that's linked to hubert.dilbert.ee either that rings bells, or it doesn't :)
Does bitnodes actually keep track of IP addresses relaying blocks from their point of view? If not, I'm not sure how you would link them unless you've got your own well-connected node (in which case their API only offers some voluntary metadata? Haven't looked at it yet). I thought bc.i was fairly unique in (and sometimes criticized for) associating transaction/block data with IP addresses.
DeleteMaybe not “provably” but as you say it might be possible to get an estimate with a confidence interval using only a small number of assumptions, that might be useful until VPNs find widespread use. It seems like it might be a good project for a Sunday afternoon. I’ll get a dataset together, let me know if you want a crack at it.
The bitnodes API that I’m using provides times and IP addresses for the first ten clients that the bitnode monitor receives notification of a new blockhash - though no conclusions about IP addresses correlating with a particular blockmaker. The API itself doesn’t seem to be public, either (or it might be on a page I haven’t seen).
First ten nodes should be a good wealth of data. Should definitely increase confidence for those cases where a 'neighboring' node just happens to be a smidgen faster while the 'origin' node comes in second; bc.i only reports the first one, so any confidence there has to come more from quantity than quality of data. I didn't spot anything about block relaying in the bitnodes API, so that's probably private - best keep to yourself, I can always inquire with them :)
DeleteAs an aside - interesting to see that the difficulty barely changed. Looking forward to the stats of June 28th :)
> I didn't spot anything about block relaying in the bitnodes API, so that's probably private - best keep to yourself, I can always inquire with them :)
DeleteSure - check that Addy doesn't have a problem with me sending you a summary of the data I got from bitnodes, it would save hime some bandwidth and you some time.
> As an aside - interesting to see that the difficulty barely changed. Looking forward to the stats of June 28th :)
Done - your wish is my etc.